

Seeing the future is difficult, but for business owners and managers it is essential for growing a thriving business. Reducing the future to numbers can be even more challenging. It is easy to get lost in details and miss the big picture. However, my goal for this blog post is to help you predict the future in numbers.
To See the Future, You Must Have a Clear Vision of the Past
No one taught me to do what I am covering in this blog post. As I worked with new clients, I noticed that I used the same process every time. This process was not documented. It is just what I do, and it works. In less than two hours, I gain a good understanding of the business, its successes, and its challenges.
Don’t get me wrong; I still have questions for the CEO, but this process gets me off to a great start. It is not that I am that smart; it is just how I am designed. By following the instructions below, now you can do this process too. It will help you see your numbers just as a Chief Financial Officer (CFO) does.
Review
In a recent blog post, I reviewed the basic financial reports including the income statement, balance sheet, and statement of cash flows. Though they are basic, these reports are quite valuable. If you missed that post, click here to read it.
One important question that the basic reports do not answer is, “What can we expect?” Successful business owners and managers can see the future and plan accordingly.
In this post, I show you how I predict what your income statement will look like next year. (Predicting the balance sheet is more difficult. I will save that topic for another blog post.)
The Path to Seeing Clearly
For most businesses, the first step to predict the future is preparing a trended income statement and a trended balance sheet. I recommend preparing monthly trended reports for the last 36 months. The good news is most accounting software programs will produce this report for you. The report has the same line items as a typical income statement and balance sheet. However, instead of just one column for the previous month, it includes a column for each of the previous 36 months. I recommend exporting the report to Excel so that you can do some analysis and create some graphs.
In a seasonal business such as landscaping, I also recommend preparing a monthly trended income statement where each month represents the total for the preceding 12-month period. A 12-month view removes the impact of seasonality. You can easily prepare this report in Excel by creating a separate tab.
If you have 36 months in your trended statement tab, you will have 25 columns of numbers in your rolling 12-month spreadsheet tab. For example, the first column will sum months 1-12, the second column will sum months 2-13, the third column will sum months 3-14. This pattern continues all the way to the 25th column where it sums months 25-36.
Why is it important for seasonal businesses to use a trended income statement with the preceding 12-month periods? This type of business has some great months, some average months, and some poor months. When you see a trended income statement where each column sums the previous 12 months, then each column contains the great, average, and poor months. Then you can see how the results change over time.
Working with Percentages
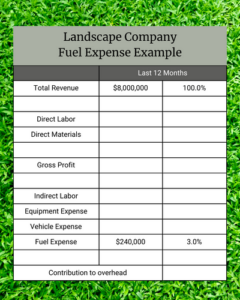
For most businesses, I convert the dollar amounts of expenses to percentages of revenue in the trended income statement using the previous 12-month periods. For example, a landscape company may have fuel costs of $240,000 for the last 12 months. I want to know what percent of revenue the $240,000 represents. If the company’s revenue is $8 million over the last 12 months, then fuel expense is 3.0% of revenue. (By the way, that 3.0% is the average fuel expense across the companies in The Herring Group 2022 Landscape Industry Peer Benchmarking Report. If you are in the landscape business, how do you compare?)
If that process sounds too complicated, just drop me a note in our contact form and I will send you a step-by-step process for creating your trended income statement along with an Excel template that you can use.
Seeing the Future
Seeing the historical trends helps a trained reader see the future. Seeing the future through the trended statements provides a good start for preparing budgets or forecasts.
A budget represents a management team’s commitment to specific results for a period of time, generally one year. The budget shows the financial impact of management’s plans for the future – both spending and revenue production plans. Budgets typically show the team’s intention to increase the value of the company by growing revenue, improving profitability, or both. The team must use creativity to overcome any interim shortfalls so that the company meets the budget.
A forecast is the owner’s or CFO’s view of what is likely to occur in the future. The forecast is based on company history, current performance, and opportunities. The forecast is valuable when cash is short or when significant investment decisions must be made. Investment decisions include hiring more employees and managers and purchasing additional equipment.
In my next blog post, I will review some great practices for preparing a budget efficiently. To move from the academic to the practical, I will continue using landscape companies as an example.