
This article originally appeared on LandscapeManagement.net on June 2, 2020. Greg Herring regularly writes for Landscape Management, providing financial analysis and insights tailored to landscape business owners.
BrightView released its results for the quarter ended March 31. See the tables below. In its public filings and remarks, the company made the following comments about COVID-19:
- 67 COVID-19 infections out of 21,000 employees
- 1,000 employees quarantined who had been exposed
- Q3 2020 overall revenue is trending down approximately 5 percent due to COVID-19 related impacts
- Contract base maintenance revenue levels remain steady at 97 percent of pre-COVID-19 levels with softness in the hospitality and retail verticals and stability in HOA and commercial sectors
- Experiencing softness in ancillary maintenance services
Because of COVID-19, BrightView made the following changes in its operations:
- Adopted early CDC guidelines regarding safety as it relates to sanitation, gloves, masks, etc.
- Eliminated nonessential travel
- Limited crews to five employees
- Reduced the maximum employees per truck from five to two
- Implemented a work from home policy
- Froze salaries
- Froze merit-based bonuses
- Suspended 401(k) matching temporarily
- Promoted a cost containment and reduction mentality
- Planned no acquisitions in the current quarter while anticipating increased opportunities in the 2nd half of fiscal 2020 due to current and changing market conditions.
BrightView’s revenue declined $37.5 million or 6.3 percent for the quarter ended March 31, 2020, compared with the quarter ended March 31, 2019. That decline was primarily a result of $91.4 million in reduced snow revenue, offset by $29.0 million in revenue from companies acquired in the last 12 months, growth of $19.6 million in its construction division, and growth of $5.3 million in commercial landscape maintenance revenue.
In its public reports, BrightView “adjusts” its earnings before interest, tax and depreciation and net income for certain expenses. I have used these same adjustments for operating income. The idea is that these expenses are not part of ordinary operations. Historically, the adjustments include expenses associated with business transformation and integration ($8.9 million in the most recent quarter), becoming a public company and paying some employees partially through equity-based compensation ($4.9 million in the most recent quarter). The most recent quarter also included $1.1 million in COVID-19 related expenses.
For the accounting experts: Note that I have excluded from operating income the expense related to the amortization of intangible assets that were recorded as BrightView acquired other businesses. Since most landscape companies do not have amortization of intangible assets, I have excluded it, so they can compare their numbers to BrightView’s numbers.
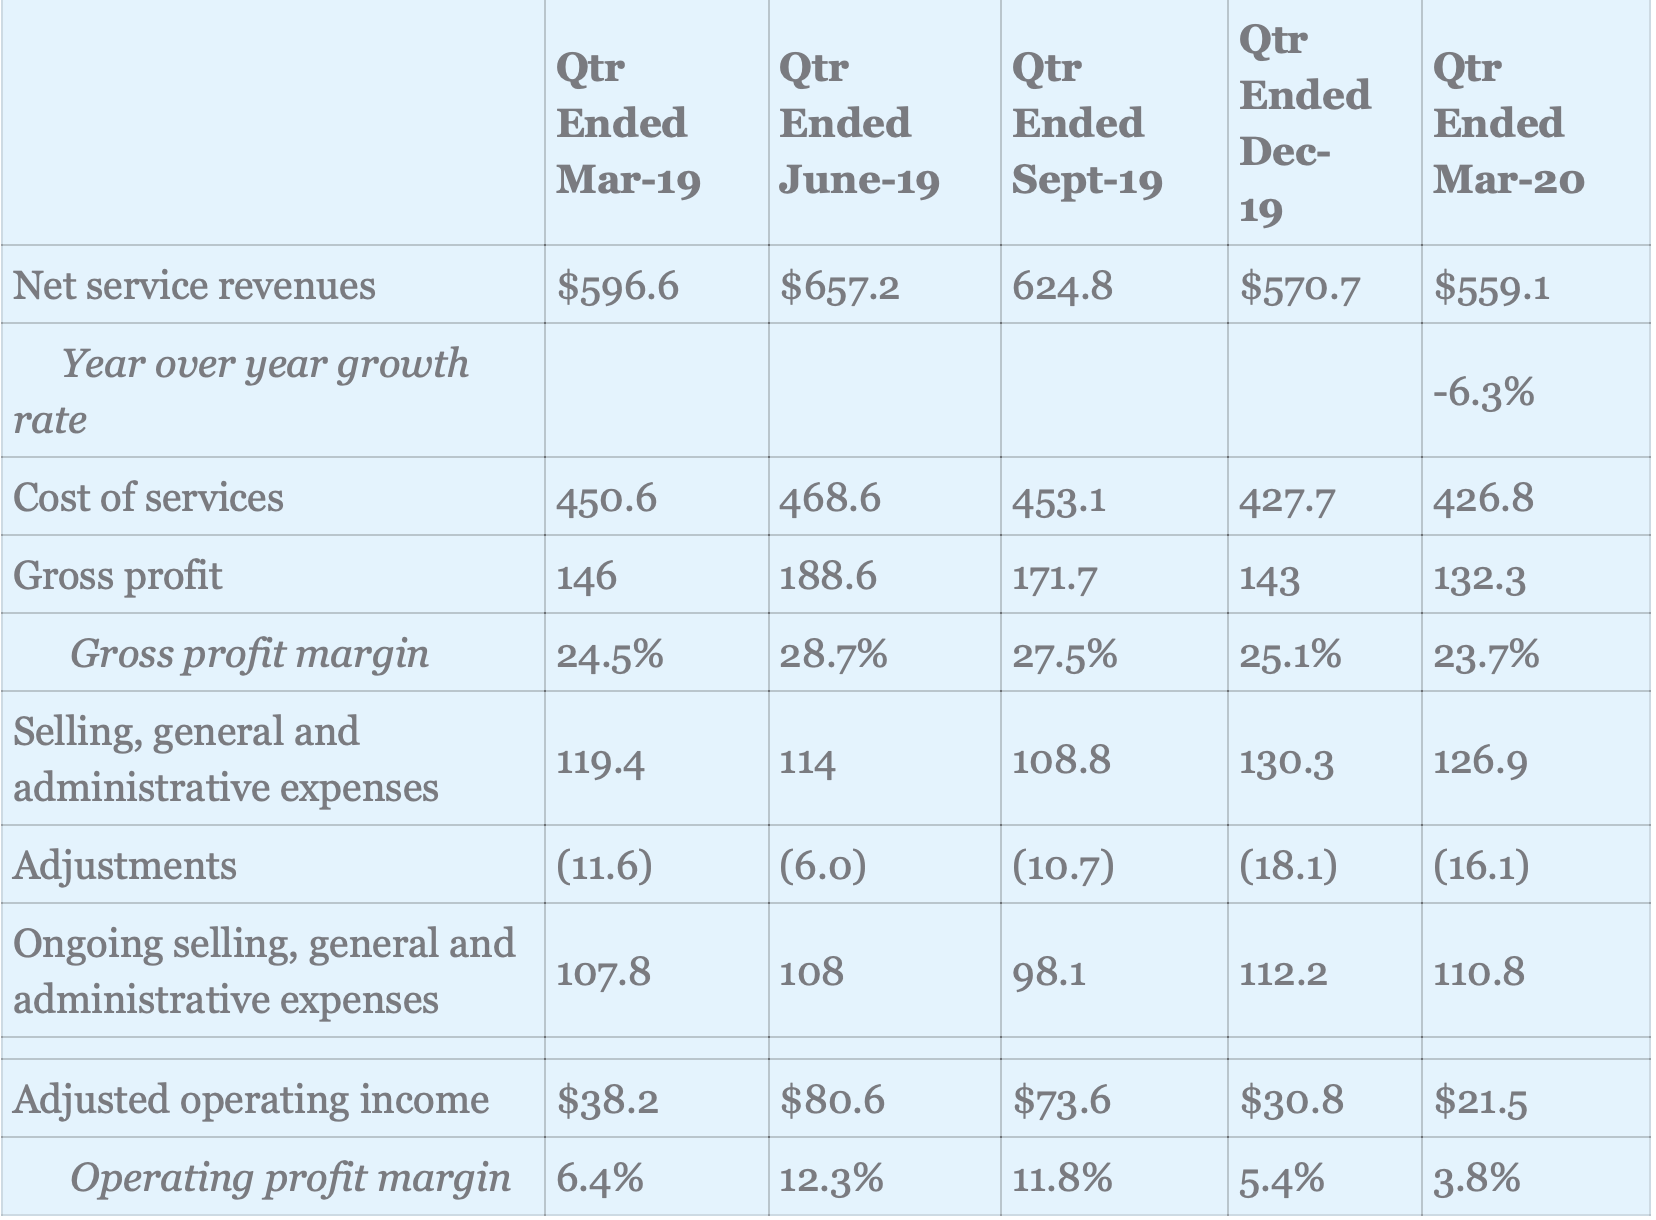
To see short-term trends, the following table shows operating results for each of the past five quarters:
| Qtr Ended Mar-19 | Qtr Ended June-19 | Qtr Ended Sept-19 | Qtr Ended Dec- 19 | Qtr Ended Mar-20 | |
| Net service revenues | $596.6 | $657.2 | 624.8 | $570.7 | $559.1 |
| Year over year growth rate | -6.3% | ||||
| Cost of services | 450.6 | 468.6 | 453.1 | 427.7 | 426.8 |
| Gross profit | 146 | 188.6 | 171.7 | 143 | 132.3 |
| Gross profit margin | 24.5% | 28.7% | 27.5% | 25.1% | 23.7% |
| Selling, general and administrative expenses | 119.4 | 114 | 108.8 | 130.3 | 126.9 |
| Adjustments | (11.6) | (6.0) | (10.7) | (18.1) | (16.1) |
| Ongoing selling, general and administrative expenses | 107.8 | 108 | 98.1 | 112.2 | 110.8 |
| Adjusted operating income | $38.2 | $80.6 | $73.6 | $30.8 | $21.5 |
| Operating profit margin | 6.4% | 12.3% | 11.8% | 5.4% | 3.8% |
To view this chart as an image, click here.
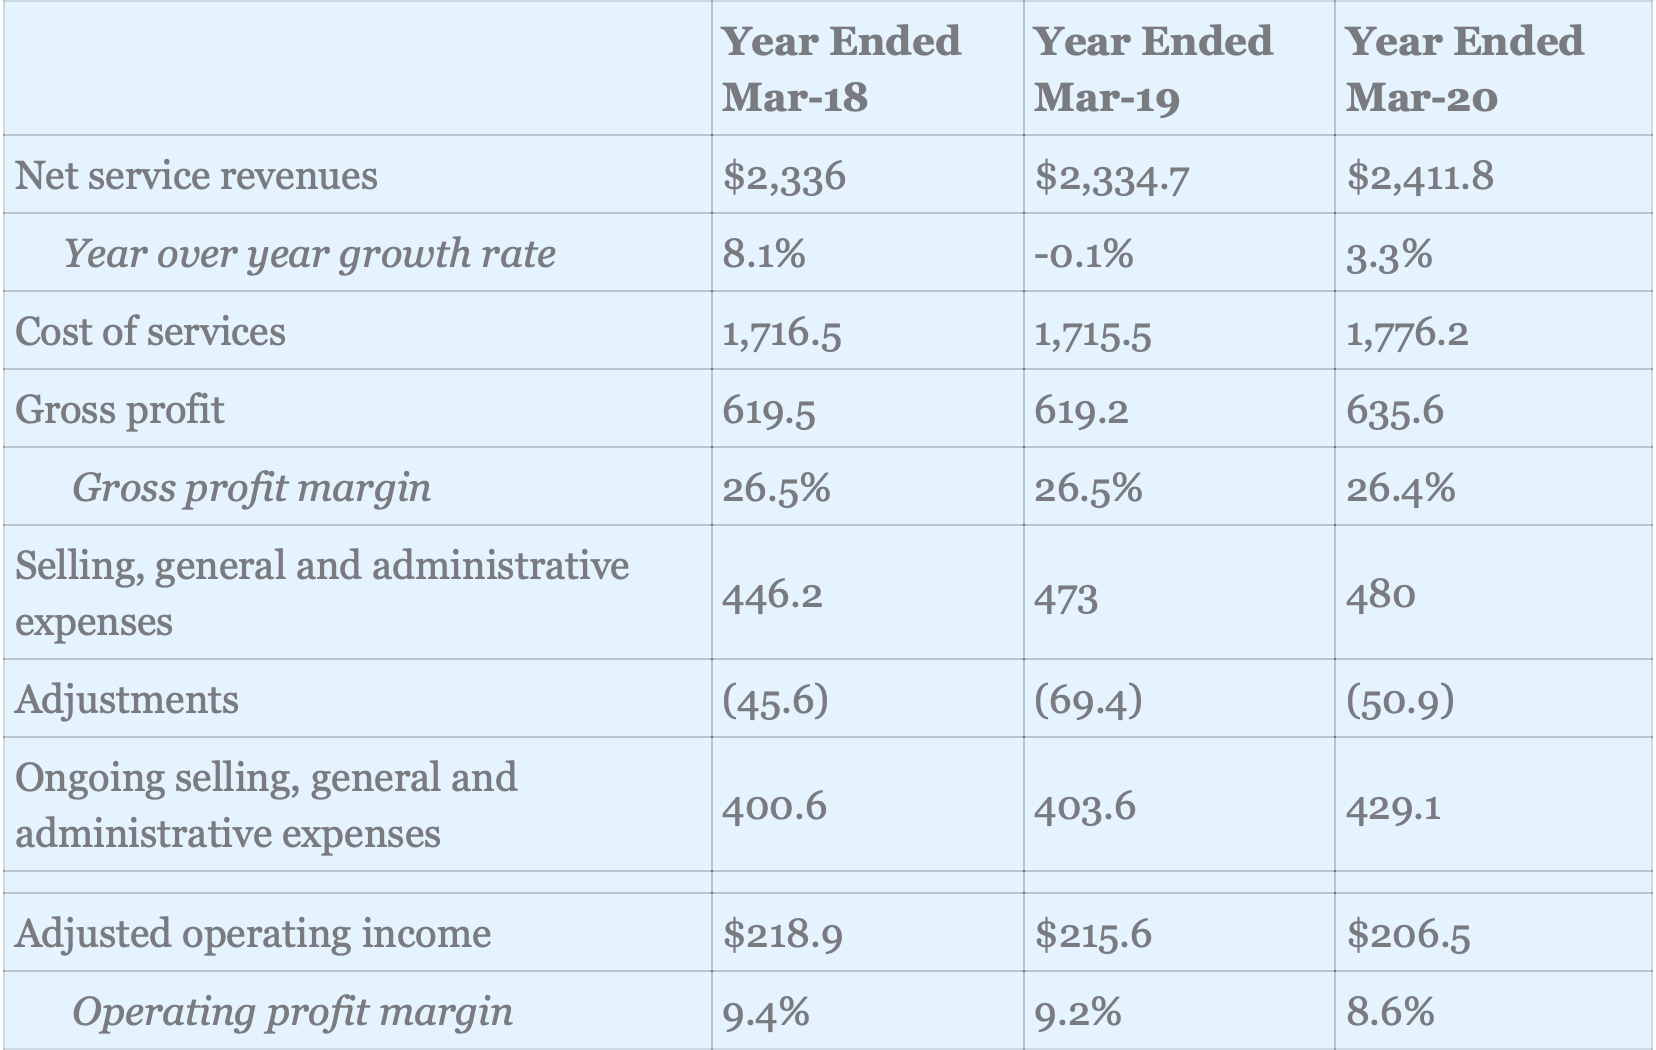
To see long-term trends, the following table shows operating results for each of the past three years:
| Year Ended Mar-18 | Year Ended Mar-19 | Year Ended Mar-20 | |
| Net service revenues | $2,336 | $2,334.7 | $2,411.8 |
| Year over year growth rate | 8.1% | -0.1% | 3.3% |
| Cost of services | 1,716.5 | 1,715.5 | 1,776.2 |
| Gross profit | 619.5 | 619.2 | 635.6 |
| Gross profit margin | 26.5% | 26.5% | 26.4% |
| Selling, general and administrative expenses | 446.2 | 473 | 480 |
| Adjustments | (45.6) | (69.4) | (50.9) |
| Ongoing selling, general and administrative expenses | 400.6 | 403.6 | 429.1 |
| Adjusted operating income | $218.9 | $215.6 | $206.5 |
| Operating profit margin | 9.4% | 9.2% | 8.6% |