
This article originally appeared on LandscapeManagement.net on February 19, 2020. Greg Herring regularly writes for Landscape Management, providing financial analysis and insights tailored to landscape business owners.
Key points for the quarter ended Dec. 31, 2019:
- Overall adjusted operating income down
- Landscape maintenance revenue down before considering the effect of acquisitions
- Maintenance services (landscape and snow) profit margin down due to increased investment in sales team and incentive compensation expenses
- Construction revenue up
To keep the stock price increasing, most public companies must grow revenue and operating income. As explained in a previous article, BrightView needs a rising stock price to sell stock to repay its debt and provide an exit to its private equity investors.
BrightView grew its revenue $44.7 million or 8.5 percent for the quarter ended Dec. 31, 2019, compared with the quarter ended Dec. 31, 2018. That growth was primarily a result of revenue of $23.2 million from companies acquired in the last 12 months and growth of $18.4 million in its construction division.
Excluding acquisitions, BrightView’s revenue in its commercial landscape maintenance business declined $2.8 million in the most recent quarter as compared with the quarter ended December 31, 2018.
First, BrightView lost $1.7 million due to its managed exit program whereby it exits customer relationships that do not have adequate profitability. A managed exit program is a sound strategy for landscape companies and normally would result in a higher gross profit margin. Despite millions in managed exits during the last five quarters, BrightView’s gross profit margin remains the same as it was one year ago.
Second, BrightView lost $1.1 million of revenue in the quarter ended Dec. 31, 2019 as compared with the prior year quarter. We might call these losses, unmanaged exits. Importantly, the $1.1 million in unmanaged exits is net of new customer revenue acquired by its 200-plus person sales staff. This inability to replace customer revenue from unmanaged exits does not tell a compelling growth story for the core commercial landscape maintenance business.
If your company competes with BrightView, I encourage you to prepare for increased competition and for the possibility that BrightView might hire your business development people. Simply put, to repay its debt and grow its stock price, BrightView must grow its commercial landscape maintenance revenue.
BrightView’s adjusted operating income for the quarter ended Dec. 31, 2019 was $30.8 million, a decrease of $1.6 million from the prior year quarter. BrightView’s maintenance services division operating profit margin was down approximately 100 basis points due to increased investment in the sales team and increased incentive compensation.
In its public reports, BrightView “adjusts” its earnings before interest, tax and depreciation and net income for certain expenses. I have used these same adjustments for operating income. The idea is that these expenses are not part of ordinary operations. Historically, the adjustments include expenses associated with business transformation and integration ($8.3 million in the most recent quarter), becoming a public company and paying some employees partially through equity-based compensation ($8.5 million in the most recent quarter). Of note, business integration and transformation costs increased $4.0 million in the most recent quarter as compared with the quarter ended Dec. 31, 2018.
For the accounting experts: Note that I have excluded from operating income the expense related to the amortization of intangible assets that were recorded as BrightView acquired other businesses. Since most landscape companies do not have amortization of intangible assets, I have excluded it, so they can compare their numbers to BrightView’s numbers.
To see short-term trends, the following table shows operating results for each of the past five quarters:
| Qtr Ended Dec-18 | Qtr Ended Mar-19 | Qtr Ended June-19 | Qtr Ended Sept-19 | Qtr Ended Dec-19 | |
| Net service revenues | $526 | $596.6 | $657.2 | $624.8 | $570.7 |
| Year over year growth rate | 8.5% | ||||
| Cost of services | 394.1 | 450.6 | 468.6 | 453.1 | 427.7 |
| Gross profit | 131.9 | 146 | 188.6 | 171.7 | 143 |
| Gross profit margin | 25.1% | 24.5% | 28.7% | 27.5% | 25.1% |
| Selling, general and administrative expenses | 110.1 | 119.4 | 114 | 108.8 | 130.3 |
| Adjustments | (10.6) | (11.6) | (6.0) | (10.7) | (18.1) |
| Ongoing selling, general and administrative expenses | 99.5 | 107.8 | 108 | 98.1 | 112.2 |
| Adjusted operating income | $32.4 | $38.2 | $80.6 | $73.6 | $30.8 |
| Operating profit margin | 6.2% | 6.4% | 12.3% | 11.8% | 5.4% |
To view this chart as an image, click here.
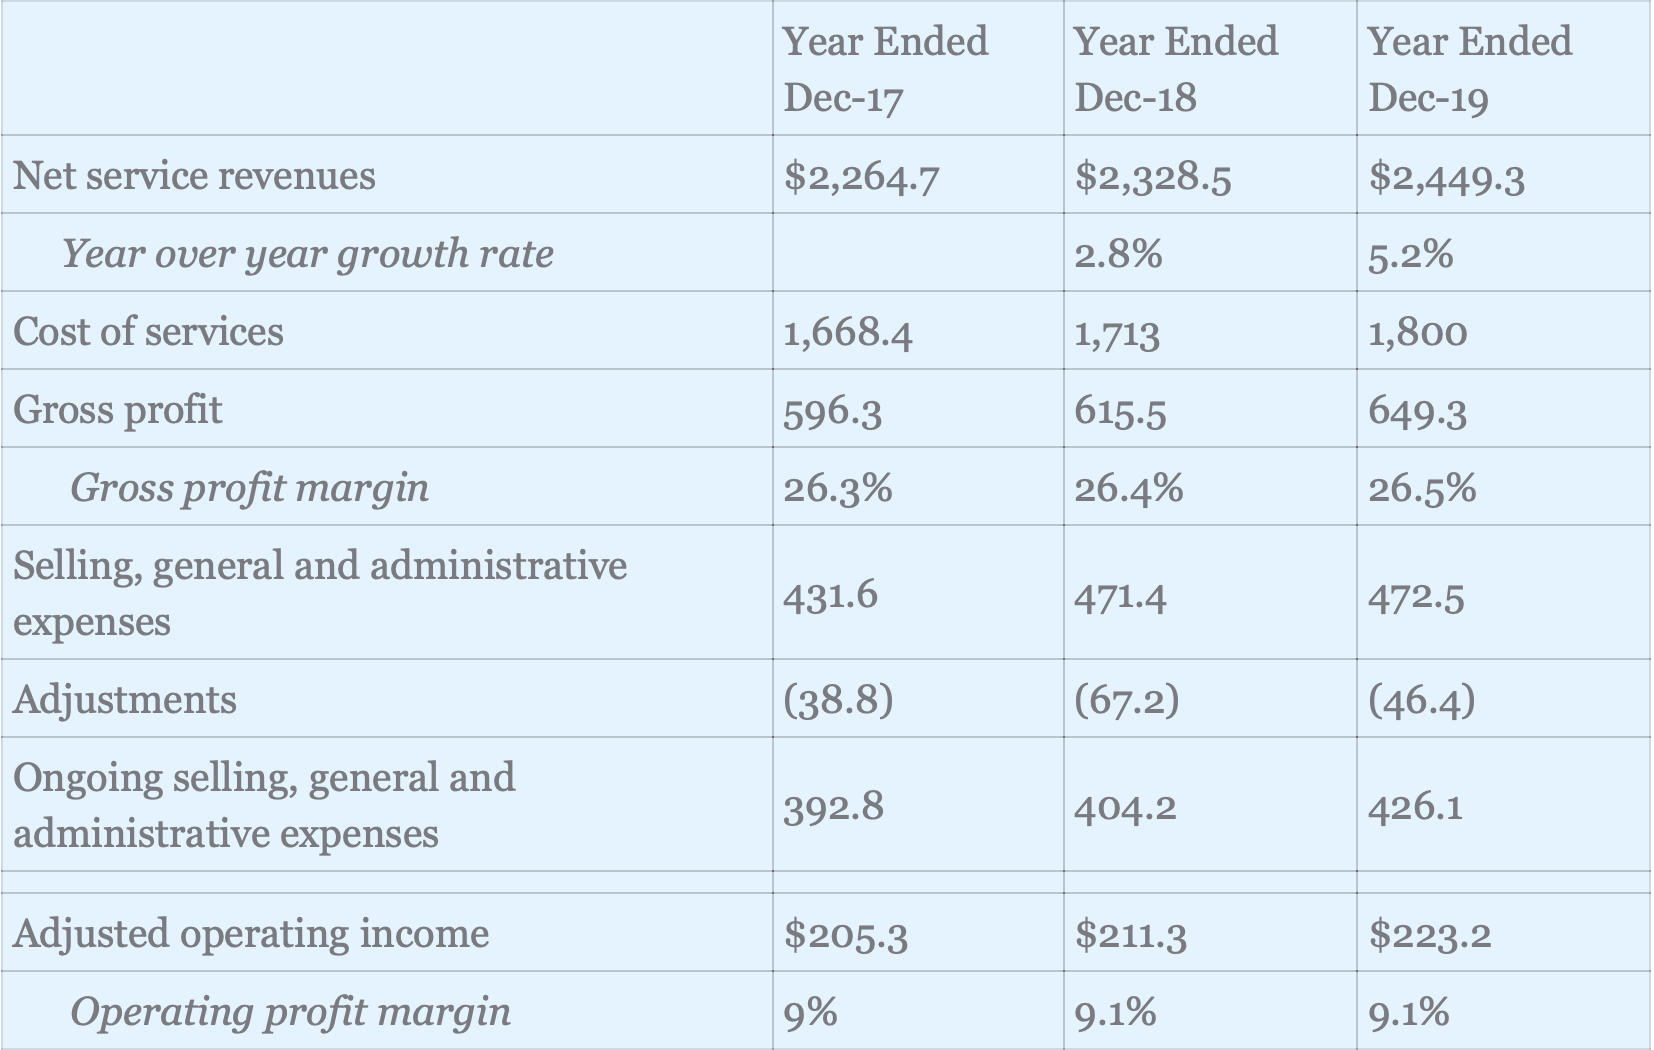
To see long-term trends, the following table shows operating results for each of the past three years:
| Year Ended Dec-17 | Year Ended Dec-18 | Year Ended Dec-19 | |
| Net service revenues | $2,264.7 | $2,328.5 | $2,449.3 |
| Year over year growth rate | 2.8% | 5.2% | |
| Cost of services | 1,668.4 | 1,713 | 1,800 |
| Gross profit | 596.3 | 615.5 | 649.3 |
| Gross profit margin | 26.3% | 26.4% | 26.5% |
| Selling, general and administrative expenses | 431.6 | 471.4 | 472.5 |
| Adjustments | (38.8) | (67.2) | (46.4) |
| Ongoing selling, general and administrative expenses | 392.8 | 404.2 | 426.1 |
| Adjusted operating income | $205.3 | $211.3 | $223.2 |
| Operating profit margin | 9% | 9.1% | 9.1% |